Collect data the way You want to
 There are three possibilities for getting production reports:
- Report production in Petkafy directly.
- Import reports from Your ERP or Excel file and update or leave them as they are.
- Set up live syncronization of production reports between ERP and Petkafy and complement the data as needed.
![]() The last option can be implemented with Petkafy Site Install and is beneficial in cases where ERP does not offer the possibility to report scrap and stoppages in the manner that would provide any valuable statistics for analysis. Older ERP-s do not allow You to report scrap and stoppages by types sometimes, so You are not be able to see what caused the quality problems or waste of machine hours, make proper analysis and improve Your performance by targeting the most important issues.
The last option can be implemented with Petkafy Site Install and is beneficial in cases where ERP does not offer the possibility to report scrap and stoppages in the manner that would provide any valuable statistics for analysis. Older ERP-s do not allow You to report scrap and stoppages by types sometimes, so You are not be able to see what caused the quality problems or waste of machine hours, make proper analysis and improve Your performance by targeting the most important issues.
Petkafy is designed to do all that and to prevent double reporting it allows You to report production in ERP, syncronize the data automatically with Petkafy and add more information to the report in a window next to Your ERP user interface without closing it in the mean time.
Collect as much data as You need
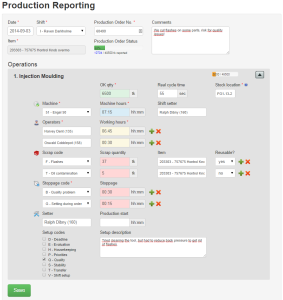
 Petkafy allows superiour production reporting flexibility. For example You can:
- define Your own scrap, stoppage and setup codes for each department,
- report unlimited number of operators per job,
- report as many different scrap and reject lines with any scrap code as You need,
- report as many stoppages per job as You really had with any stoppage code,
- collect data about set-ups and production start on the same report,
- give comments and feedback about any issues during production.
Petkafy will figure out the logic behind Your report, prefill form fields as You enter the data and visualize Your manufacturing progress.
This way You can keep it simple, but are also free to collect sufficient amount of data to ensure that it will support Your production monitoring and improvement efforts.
Helping not only to produce efficiently, but also to report so
 Petkafy knows Your tool configurations, so it will use this data to help You. In case You are reporting items from a 1+1 tool (LH and RH parts produced in one shot), for example and You have reported the LH parts already, it will predict that You might be reporting the RH part just as soon as You have selected the item number, date and shift and it will prefill almost all fields on Your report.
You will only have to state the produced quantity, add some scrap if there was any and click “Save”. This will save Your valuable time during production reporting.
If Your part has more operations than just one, Petkafy will allow You to report all of them on a single form, so You will not have to save data of one operation and come back to enter the data of the next one. Anyone who knows how boring it is to report tens of produced items can probably appreciate this.
Progress at a glance
 As a serial production company Your production orders can be issued on a greater quantity of parts than You can produce in one shift. According to Lean principles the personnel reporting the production should be able to notice any overproduction immediately and pull the breaks. Therefore the reported quantities of each operation and the total production order are visualized to the person live during data input. In case the actual production quantity exceeds the ordered amount the progress bar turns red helping him or her to notice that it might be a good idea to stop the machine or the production line.
 Petkafy provides visual information about the progress of each order in the list of active Production Orders, so You will be able to see how far You are even before starting to input any data. In case of questions You can just click on the progress bar and Petkafy will show You the list of all the actual production reports related to the respective Production Order.
 Your machine schedule (plan) is automatically updated with the latest data and Your production planner can see the the status of each planned production run in Production Planning view directly next to each machine. This way he or she does not have to look and wait for data and can take immediate actions in case of delays and notice overproduction timely too.
Get the whole picture by monitoring also non-value-adding hours
 Your operators and other employees are doing a lot of other things too in addition to actual production.
Someone might be cleaning the machines, another could be sorting parts because of quality problems and so on. On one hand it would not be efficient or logical to report such activities as production operations, but on the other hand these hours would be lost for good if they are not reported at all.
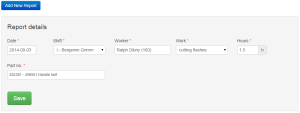
 If You want to see the complete and correct overview of the activities on which each employee’s working hours are spent, You can report accessory works in Petkafy as well. Petkafy provides option to require the part number in case the work is product related and You will see what item was sorted, cleaned of flashes or whatever nonvalue-adding activities were performed with it.
Performance feedback for immediate actions
 Production reports are listed in a comfortable and flexible reports list we like to call “Daily Report”. It provides fast feedback to production planner, production manager and anyone else interested in daily or shiftly monitoring of actual manufacturing performance compared to planned values, investigating deviations and taking immediate actions to achieve as high production run efficiency as possible.
The report provides the following at a glance for selected shift, item, production order or machine in any period:
- efficiency calculation including scrap and stoppage data of each reported production run,
- deviation highlights between planned cycle time and actual cycle time,
- combined total efficiency values including scrap and stoppage,
- operator efficiency overview,
- visual representation (chart) of scrap statistics,
- visual representation (chart) of stoppage statistics,
- option to update any of the reported production runs directly.
Overview of reported machine hours with a single click
 It would be hard to keep track and check if all hours on all machines have been properly reported, but Petkafy will povide a simple overview showing reported hours on each machine on each date and in each shift.
Your shift leaders, production planner or production manager can get a complete picture of reporting in just one click and in case the reported hours raise new questions or there are some obvious deviations a click on the respective date, shift or machine hours will take you to the list of related production reports for further analysis. This way You can be sure that each machine is properly reported and that Your production performance (OEE, Capacity Utilization, etc.) measuring will not be distorted or incomplete.
And finally it is once again worth to mention thatPetkafy does know in case of 1+1 or similar tools producing more than one item per cycle that You produced 8 hours of LH part no matter if You report the RH part too or not, because it knows Your tool configurations and can calculate the machine hours correctly taking simultaneous production into account.
Reporting is a complex activity and knowing that data is worth nothing if it is never used we have designed Petkafy to make the best of it automatically, so Your efforts in collecting data will not be a waste, but will help You to increase the manufacturing efficiency, decrease risks for quality and also to take better planning decisions for future by providing the statistics right where You need it.
